
Q2 Index Rebalance Highlights + Report
March 31st, 2021 Rebalance Highlights
Summary:
Economic activity has boomed in the U.S. and some developed countries to start 2021, generating a 6.4% jump in U.S. GDP on an annualized basis in the first quarter. Except for the 2020 Q3 economic re-open GAP surge, the 2021 Q1’s GDP growth was the best period since Q3 2003. The tremendous economic growth came across a variety of areas, including increased customer spending, fixed investment, and increased imports. Recently increased government spending (President Biden’s $1.9 trillion American Rescue Plan) has been a significant driver to economic recovery and customer confidence. The enhanced and accelerated precaution programs for COVID-19 also brought about hopes of further economic booms.
However, concerns related to global economic recovery remain moving into Q2 2021. For example, it is unclear whether household savings will continuously turn into spending. There were still 10 million people unemployed in the U.S. in January 2021, among which 4 million have been out of work for over six months. It has been debated whether the economic changes caused by COVID-19 could permanently reduce the value and productivity of existing capital. Besides, the drastic surge in COVID-19 cases in India raised significant concerns on the global production, supply chains, and capital movements for Q2 2021.
During Q1 2021, U.S. and Global innovation indexes have witnessed obvious outperformance relative to their benchmarks. The U.S. innovation index returned 10.31% while the Russell 1000 index returned 7.13%. The Global innovation index returned 9.21% while the MSCI World Index returned 4.72%. The outperformance is largely contributed by the Electronic Technology, Finance, and Health Technology sector, which were overweighted by the innovation indexes relative to their benchmarks based on M-CAM’s 2021 Q1 economic forecasts.
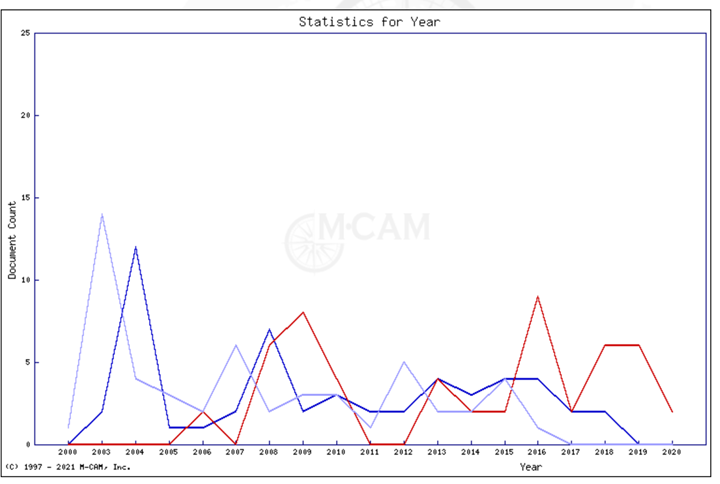
Moving into Q2 2021, Electronic Technology and Health Technology still represent the most significant sector weights in both the U.S. and Global Index. These two sectors and their over 40% contribution to the indexes are likely to represent a direct response to COVID-19 and the short-term effects of social distancing and workplace alterations. While the indexes reflect these market exigencies, there is no evidence that fundamentally novel innovations are arising during this time. As a matter of fact, in the diagnostics and testing arena, most of the technologies deployed for COVID-19 are derived from relatively dated patent portfolios. The coronavirus patent landscape of over 5,100 patents on the virus, its detection, treatments, and vaccinations have an average age of over ten years.
In summary, the COVID-19 period is providing business cases for the implementation of aging technology – not necessarily the origination of new innovation. In the coming months, we will be monitoring the emergence of new technology and see when indicators of persistent market changes arise.
Innovation α® Global Index & Innovation α® United States Index
For the U.S. innovation index, the Technology Services and Producer Manufacturing sector have increased their weight by 5.71% and 1.77%, representing the top two sectors with highest weight change. The Electronic Technology and Finance sector have decreased by 5.13% and 4.62%, largely due to their peak performance during Q1 2021. The weights of Microsoft Corporation and Alphabet Inc. have increased by the largest moving into Q2 2021, signaling a positive investor prospective based on their favorable financial performance during the last quarter.
Similar to the U.S. index, the weights of the Technology Services and Producer Manufacturing sectors have surged by the largest, and the Electronic Technology and Finance sector have plummeted the largest. For individual companies, Applied Materials, Inc., and Callaway Golf Company are the top two companies with the highest weight change. In general, the expectation for Q2 2020 on market resilience fueled by innovation is generally focused on companies with diversified business sectors and supply chains, feasible and flexible management abilities on intellectual property, and the demonstrated capability in global integration. Joint efforts and innovation cooperation by healthcare technology companies from different countries are expected to face continuous challenges of COVID-19 and economic recovery.
The full report including detailed figures and weightings can be downloaded as a PDF here
Sorry, the comment form is closed at this time.