The most innovative companies in the Innovation α Index saw a large decline in financial market performance as the COVID-19 pandemic spread.
Electronic Technology, Technology Services and Consumer Nondurables are gaining dominance among US sectors, especially those that can provide innovative solutions to fight the COVID-19 pandemic.
In the US, the performance of Distribution Services, Technology Services, Retail Trade, and Consumer Non-Durables sectors was the least negative; however, the Distribution Services and Retail Trade sectors will see a reduced weight in the index going forward.
Despite global volatility in stock markets, globally theperformance of the Retail Trade sector essentially held steady in Q1.
In Q1 2020, The Conference Board Innovation α Index powered by M•CAMfor the United States declined by 23 percent and was down nearly 14 percent from a year ago. At the same time, the parallel global Innovation α Index, which tracks innovative companies worldwide, declined by 24 percent, and was down by 14 percent over a year ago. However, the reweighting of sectors in the index is pointing at potential benefits for innovative companies that can help tackle or offset the negative effects from COVID-19.
In this type of supply-side crisis, obviously no sector goes unscathed and this includes the most innovative companies in the United States and around the world.
Bart Van Ark, Executive Vice President and Chief Economist at The Conference Board
For the last few weeks, we’ve been following an interesting story of opportunism, greed, and corruption. On March 6, 2020, The Corporation Trust Company registered a new Delaware LLC named “Labrador Diagnostics.” On March 9, 2020, this same Labrador, owned by investment funds managed by Fortress Investment Group LLC, filed a patent infringement lawsuit in the District of Delaware to “protect its intellectual property.” Two days later, the defendant announced that they were developing test kits for Covid-19. Fortress Investment was terrified of the PR ramifications of being seen as exploiting the pandemic, and rightly so. Within a week, they were under fire.
While this seems like a generous, philanthropic act, and more gutless observers may be tempted to drop the scrutiny, we see things differently. A patent troll (tragically the path Fortress took when IP financing for constructive business proved too hard) is still a patent troll, regardless of whether they are spinning free licenses to their worthless patents off as virtuous acts or not.
Ataman Ozyildirim, The Conference Board’s Senior Director of Economics and Chair of Global Research published an op-ed today about our their Innovation Indexes, powered by M·CAM.
What keeps business leaders up at night? In a recent global survey, CEOs rank creating more innovative cultures as their third biggest internal challenge for 2020. Creating new business models comes in second. And attracting and retaining top talent – a key driver of innovation – takes the top spot.
Even though innovation is so important, there’s little agreement – and lots of confusion – on how to measure it. That comes as no surprise, given the complexity of innovation. It is often very intangible.
But some tangible signs of innovation can be measured. Take intellectual property, for example, which receives protection from patents, trademarks, and copyrights.
Technology Manufacturing and Service Sectors Outperformed Other Innovative Companies in Q4
Annual Benchmarking of Innovation α Index Suggests Larger Role for Health Technology and Technology Services ▪ The most innovative companies in the US and globally improved their stock market performance in Q4, ending the year on a strong note ▪ Technology manufacturing and service sectors are regaining dominance, the result of increased consumer spending power and confidence ▪ An easing of trade tensions may help bolster global innovators, especially in technology and producer manufacturing ▪ Q1 will see increased shares of telecommunications equipment and motor vehicles in the global index, and health technology and aerospace & defense in the US index
On January 4, 2020, our CEO Dr. David E. Martin and team will be joining Carol Corrado, a Chief Economist at The Conference Board, to present their joint paper “Innovation- α : What Does an Intangibles-intensive Stock Price Index Tell Us about Business Profitability and Productivity?”
Stock prices are a leading indicator of economic activity in the United States, e.g., they are a component of The Conference Board’s U.S. Leading Economic Index. This paper re-examines stock prices and business productivity in light of the growing importance of intangible investment in overall investment in recent decades (Corrado and Hulten, 2010; Haskel and Westlake, 2017). The new information brought to bear in this paper is the M·CAM database (Martin 2004, 2013; Luse and Martin 2014). This database includes traditional full-text patent and other IP data (such as state-granted rights) and includes both explicit citation information together with implicit conceptual association calculated using M·CAM’s proprietary linguistic genomic algorithms that provide estimates of the uniqueness, quality, and value chain associations of patents across companies. The M·CAM database is used to estimate a stock price index of companies determined to have the strongest ties between their holdings of intangible assets and the company’s future profitability. We find that (a) the intangibles-driven stock price index is 10 percent higher than the S&P 500 since its real-time inception in July 2015 and greatly outperforms the S&P 500 over its backcasted history, which extends to July 2007; (b) IP and other innovation assets are essential business assets of over 70 percent of the Standard & Poors 500 and the Russell 1000; and (c) that M·CAM’s sector-level IP data are “value added” indicators of the sector’s technological capability vis a vis “raw” indicators such as WIPO or USPTO patent counts.
Innovative Companies Continue to Outperform the Market, Despite Headwinds in Global Economy
NEW YORK, Oct. 1, 2019 /PRNewswire/ — The most innovative companies in the United States
and global stock markets are not shielded from significant challenges
in terms of stock market performance, according to a quarterly update of
two new indexes by The Conference Board.
The global economic uncertainties of the second quarter of 2019 deepened during the third quarter. Economic growth has continued to slow due in part to the persistence of global economic tensions. In August, the St. Louis Federal Reserve reported sluggish growth in industrial production and confirmed the 2% GDP growth for the US. Market sentiment has been focused on the refrains of “financial crisis”, “recession” and other media-fueled risk-factor legacies of the 2008 global financial crisis. The increasing tariff uncertainty between the US and China continue to impact the confidence of global trade and investment leading to a $54 billion drop in US international trade in goods and services in July 2019. An increase in energy price volatility was triggered by a series events starting with Britain’s seizure of an Iranian tanker in Gibraltar (not surprisingly underreported in Western media) in early July which triggered Iran’s (highly publicized) reprisal seizure of the British tanker in the Strait of Hormuz later that month. Adding to the volatility were Yemeni aerial attacks on the Saudi Arabia oil facilities which disrupted the global oil supply chain for several weeks. The outlook for Brexit remains obscure. US monetary policy stays confusing and unpredictable based in large part on the President’s inability to respect the statutory independence of the Federal Reserve. Despite the robust growth of the global employment, the IMF lowered its 2019 global economic growth projection by around 0.2 percent compared to its April update. The Conference Board also lowered its global outlook projections by 0.3 percent compared to its November 2018 outlook, and has predicted the U.S. growth rate to slow to its 2% long-term potential.
M·CAM’s view of innovation activity by corporations around the world indicates that several companies have used the first three quarters of 2019 to invest in agility in manufacturing and distribution –concerns highlighted in the recent global uncertainty environment. Technology transfer as a component of global procurement continues to play a role in transactions but is falling out of favor in several markets. Recent reports by the US National Academy of Sciences, the Council on Foreign Relations and others all report the alarming drop in federal funding for research which could indicate lasting negative impacts for the US economy and considerable opportunities for other markets to overtake US dominated fields.
MCAM International in Charlottesville, Virginia, launched a “trade war fund” in June, said David Martin, founder and chief executive of MCAM.
The E.T.F. tracks more than 100 companies, including Adidas, Microsoft and General Electric, which could be less affected from the pain of tariffs than others.
“We’re going through reams and reams of data to find companies that historically have succeeded in getting support in the form of waivers or non-action or benefiting from government relationships,” Martin said. The fund has had an annual return of 6.2%.”
While the fund isn’t expected to turn a profit if the broader market
tanks, Martin said, “the goal is not to go down as far as anyone else.”
Innovation α® Indexes July 1, 2019 Rebalance Highlights
The second quarter of 2019 saw remarkable market uncertainty despite a secular growth in the
equity markets generally. While trade disputes between the United States and China dominated the
headlines, underlying concerns about global growth, the perceived limited effectiveness of Central
Bank policy, and the potential geopolitical conflicts undermined confidence. Traditional financial
metrics were mixed. Employment, interest rates, and growth expectations remain low with few
inflationary concerns in most markets. The Federal Reserve Bank of New York’s Center for
Microeconomic Data reported the 19th consecutive quarter during which total household debt
increased with delinquencies increasing on the $13.67 trillion outstanding as of the end of the 1st
quarter of 2019. Similarly, corporate debt expanded during the same period. Most alarming is the
government indebtedness which continues to grow at a rate that limits the capacity to invest in
infrastructure, long-term development and pro-stimulus activities. Across the world, corporate debt
growth has grown in advanced economies by over 70% and in emerging markets (led by China) by
395% in the past decade.
While non-financial debt has fueled corporate share buybacks, mergers, acquisitions, and dividends,
concerns of the long-term effect of this growing indebtedness places headwinds on corporate
performance outlooks in developed and emerging economies.
M·CAM’s view of innovation activity by corporations around the world reveal that several companies have used the first two quarters of 2019 to invest in agility in manufacturing and distribution – concerns highlighted in the recent tariff and trade war environment. Technology transfer as a component of global procurement continues to play a role in transactions but is falling out of favor in a number of markets.
In early June, the Innovation Alpha Global E.T.F. started operations. Run by MCAM International of Charlottesville, Va., the fund is based on an index that tracks 120 companies, focusing on the strength of their intellectual property and ties to “government patronage,” which the managers expect to insulate those shares from international trade battles. The fund’s top holdings include Adidas, a German shoe company; Bayer, a German pharmaceutical compay; Microsoft; and Kering, a French luxury goods maker.
This approach is not new, according to David Martin, founder and chief executive of MCAM. “While the timing of this particular E.T.F. appears quite fortuitous, it’s been around as a trading strategy for quite a long time,” Mr. Martin said. The underlying index has helped MCAM’s investing since 2001 and has been used in its hedge funds since 2005, he said. Mr. Martin said MCAM looked at nonfinancial disclosures — such as trade complaints and agreements — to ferret out companies likely to receive support from their national governments in a trade fight. “Part of the reason our strategy works is that we look at international trade as a global phenomenon, not a national one,” he said.
The fund made its debut on June 5. By the end of the month, it was up 5.2 percent compared to 6.9 percent for the S&P 500. Mr. Martin also provided back test data — which may not reflect future returns — showing that the strategy has done well in the past.
Why do companies innovate? Part of the answer is to produce better products and services, improve the customer experience and make the production process more efficient. But at the end of the day, companies innovate to improve their financial performance.
Highly Innovative Companies Consistently Outperform the Market Despite Headwinds in Global Markets
The Conference Board Publishes Innovation Index powered by M•CAM
Companies in the index generate overall higher stock market performance in the long run relative to their benchmarks, but the index exhibited greater challenges due to market volatility in Q2 of 2019
Going forward, global trade disputes and geopolitical uncertainties may disproportionally affect global Electronic Technology Manufacturers
Health Technology, Finance, and Consumer Non-Durables top list of largest improvements in being the innovative sectors for Q3
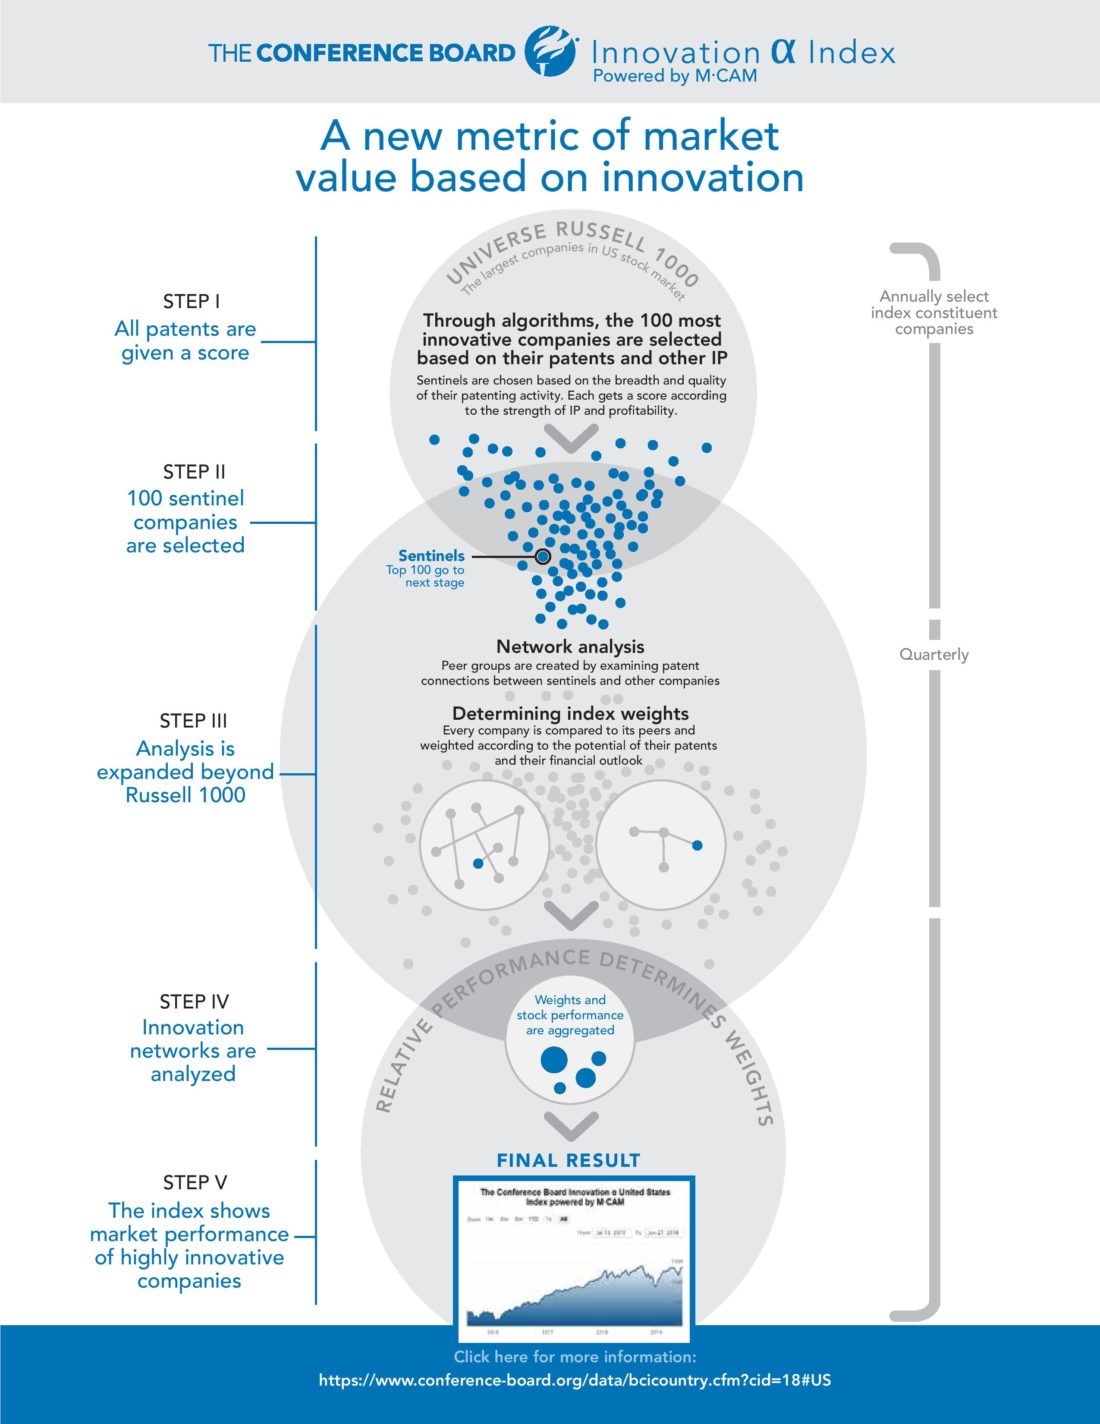
Companies focused on integrating technology to strengthen content or media delivery are likely to out- perform pure technology or media businessesNEW YORK, July 1, 2019…Can the financial outcome of innovation be measured? A new set of indexes from The Conference Board shows it can. The most innovative companies in the United States and global stock markets have undergone significant challenges in terms of stock market performance during the second quarter, according to two innovation indexes which The Conference Board will begin publishing today in partnership with M•CAM, an investment firm that analyzes intellectual property and intangible assets to support credit and equity products. Innovation indexes show that innovative companies generate better financial performance in the long run relative to their benchmarks. However, moving into the third quarter, the indexes predict that especially companies focusing their innovations in data management are demonstrating the greatest resilience in the global market. The Conference Board will publish the latest results based on the rebalancing of the indexes on the first trading day of each quarter. The indexes are benchmarked annually every January.The Conference Board Innovation α Index consists of two innovation indexes which rank and identify the 100 most innovative US companies in the Russell 1000 universe of companies and the 120 most innovative global companies in the MSCI World Index universe of companies, respectively. The selection is determined by the potential of those companies to generate substantial revenue growth through the use of proprietary technologies and innovations. The rankings result from a series of algorithms that gauge a company’s innovation standing by analyzing their patents, trademarks and copyrights and the value generated from them. The Conference Board Innovation α Index is powered by M•CAM.
“Firms that invest time, financial resources, and human capital in innovation can deliver increased value to customers, employees, and owners,” said Bart van Ark, Executive Vice President and Chief Economist at The Conference Board. “The new indexes fit squarely within our research program on innovation and intangible investment and will provide a new resource for The Conference Board to develop insights for what’s ahead in US and global innovation, serving the finance and innovation communities among our members.”
The latest quarterly reconstitution (July 1) of the company weights included the index indicates that despite the long-term outperformance of the Innovation α Indexes relative to their corresponding benchmarks (the Russell 1000 and the MSCI World Index, for the U.S. and global indexes, respectively), some sectors have become more exposed to recent economic and geopolitical headwinds during the second quarter. Electronic technology manufacturers have borne the brunt of the uncertainty in global trade disputes reaching across telecommunications, health technology, and business machines.
Based on the latest quarterly reconstitution of the weights, moving into the third quarter, companies in the health technology, finance, and consumer non-durables see increasing weights in the US index; whereas, weights for many companies in the technology services, process industries, industrial services, and consumer durables sectors are showing declines. In the global index, consumer non-durables, health technology, technology services, and manufacturing see increasing weights in the third quarter; whereas, the electronic technology sector is experiencing a decline. Innovations in data management are demonstrating resilience in the global market, shielding them from negative effects from trade disruptions. Consumer non-durables that are performing well are those that have focused their innovation on the materials supply chains that are going into their products. Companies that have innovated end-product designs or delivery are struggling.
“Looking ahead, the innovation Index shows that companies that have successfully integrated technology to create content or media delivery (for example, gaming) generate greater expectations for financial performance in the third quarter and are likely to be more resilient in volatile markets,” said Ataman Ozyildirim, Senior Director, Economic Research at The Conference Board. “From media and entertainment to health care to defense and infrastructure, companies focused on innovations in making information or services accessible and easier to use are out-performing those mostly focused on pure technology or media businesses.”
About the Innovation α
The Conference Board Innovation α Index powered by M•CAM features 120 global and 100 US rankings of large public companies in two separate indexes. The constituent companies in the indexes are expected to generate higher stock market performance than those that are not in the index because they invest in intangible assets and effectively deploy their innovations. The US and global indexes enable a direct look at the financial outcomes of the companies’ innovation activity that arises out of their intangible investments such as patents, trademarks and copyrights.
The indexes demonstrate that companies that focus on innovations – those protected with proprietary rights – will perform better in financial markets in the long-term. The companies in the indexes are weighted according to each firm’s ability to invest in, develop, control and deploy intellectual property to achieve strategic advantage over
competitors. The index is rules-based and is reweighted quarterly on the first trading day of January, April, July and October. The index is also reconstituted annually on the first trading day of January. During the reconstitution, up to ten percent of the index components may be replaced. Stock prices and market capitalization are not factors in determining index weighting.
In the US index, the top five ranked companies (based on their index weights) are Microsoft Corporation, Boston Scientific Corporation, Lockheed Martin Corporation, QUALCOMM Incorporated, and Kimberly-Clark Corporation. In the global index, the top five ranked companies are Adidas AG, Bayer AG, Daimler AG, Thales SA, and Kering SA. Microsoft Corporation is showing the largest increase in weight going forward in Q3 2019 in both indexes.
See tables on page 5 for more information on sectors and changes in weights. More information on the innovation index is available in a white paper (available here), which details the methodology and results. A complete ranking of the most innovative companies (US and global), their weights in the indexes, and their changes in weights is also available here.
Innovation α® US and Global Indexes Outperform their Market Benchmarks in the Long Run
2019 Q1Return (1/2/2019 – 3/29/2019)
2019 Q2Return (3/29/2019 – 6/27/2019)
Last Year Return (6/27/2018 – 6/27/2019)
Innovation α® US Index
14.61%
2.21%
7.75%
Russell 1000 Index
13.36%
3.11%
3.65%
Innovation α® Global Index
13.44%
2.34%
2.73%*
MSCI ACWI Index
11.89%
2.43%
3.88%
* Innovation α® Global Index launched on 1/2/2019. The last year return for this index includes part of backtest data.
About The Conference Board Innovation α United States Index powered by
About The Conference Board Innovation α Global Index powered by M•CAM The global Index uses a quantitative, rule-based methodology to measure the performance of the top 120 global companies in innovation ability. The universe of the index is similar to the MSCI World Index, including companies from the U.S., Europe, Japan, and etc.
M•CAM, the index owner, measures the innovation ability of companies by analyzing their powers in the control and deployment of intellectual property (IP), including patents, trademarks, and copyrights, etc. Since 1998, M•CAM has aggregated and maintained the world’s largest organized repository of state-granted IP from over 160 countries. This analysis provides an absolute qualitative and quantitative measure of each individual company’s innovation and management thereof. It also provides a relative score of how one company’s performance is likely to compare with others with whom it cooperates or competes. M·CAM is the Advisor for the Innovation a® Series of ETFs (INAU, INAG, and TWAR) listed on the New York Stock Exchange.
M•CAM
The US index uses a quantitative, rule-based methodology to measure the performance of top 100 US companies in
innovation ability. The universe of the index are equities of companies similar to those in the Russell 1000, including the
1000 US companies with the largest market capitalization.
About The Conference Board
The Conference Board is the member-driven think tank that delivers trusted insights for what’s ahead. Founded in 1916, we are a non-partisan, not-for-profit entity holding 501 (c) (3) tax-exempt status in the United States. www.conference- board.org.
TABLES
The Conference Board Innovation α® United States Index powered by M•CAM(INAU) Change in Weights by Industry Sector
Sector*
Change in Weight in Q3
Health Technology
3.60%
Finance
2.88%
Consumer Non-Durables
1.27%
Consumer Services
0.96%
Communications
0.28%
Energy Minerals
0.28%
Retail Trade
0.28%
Producer Manufacturing
0.17%
Health Services
0.14%
Electronic Technology
-0.28%
Consumer Durables
-1.24%
Industrial Services
-1.78%
Process Industries
-2.26%
Technology Services
-4.31%
*The classification system is FactSet Revere Business Industry Classification System (RBICS).
Sources: The Conference Board and M•CAM The Conference Board Innovation α® Global Index powered by M•CAM
(INAG) Change in Weights by Industry Sector
Sector*
Change in Weight in Q3
Consumer Non-Durables
0.90%
Health Technology
0.60%
Technology Services
0.39%
Producer Manufacturing
0.32%
Commercial Services
0.16%
Energy Minerals
0.07%
Communications
0.07%
Non-Energy Minerals
-0.01%
Finance
-0.01%
Process Industries
-0.04%
Consumer Durables
-0.15%
Consumer Services
-0.15%
Industrial Services
-0.15%
Retail Trade
-0.18%
Electronic Technology
-1.81%
*The classification system is FactSet Revere Business Industry Classification System (RBICS).
The most innovative companies in the United States and global stock markets are not shielded from significant challenges in terms of stock market performance, according to two new indexes which The Conference Board will begin publishing today.
The Conference Board has begun publishing our Indexes as a measure of innovation in the economy – read the full press release here
To others, though, the stark face-off between President Trump and his Chinese counterpart Xi Jinping is an opportunity. In the US where – much like with apps for your phone – there is an ETF for any given situation or nuance, a Charlottesville, Virginia ETF provider called MCAM International has attempted to appeal to those looking to sidestep the whole shebang.
The Week in ETFs: Risk-On Is Back for ETF Flows plus Protecting Your Money from the Trade War
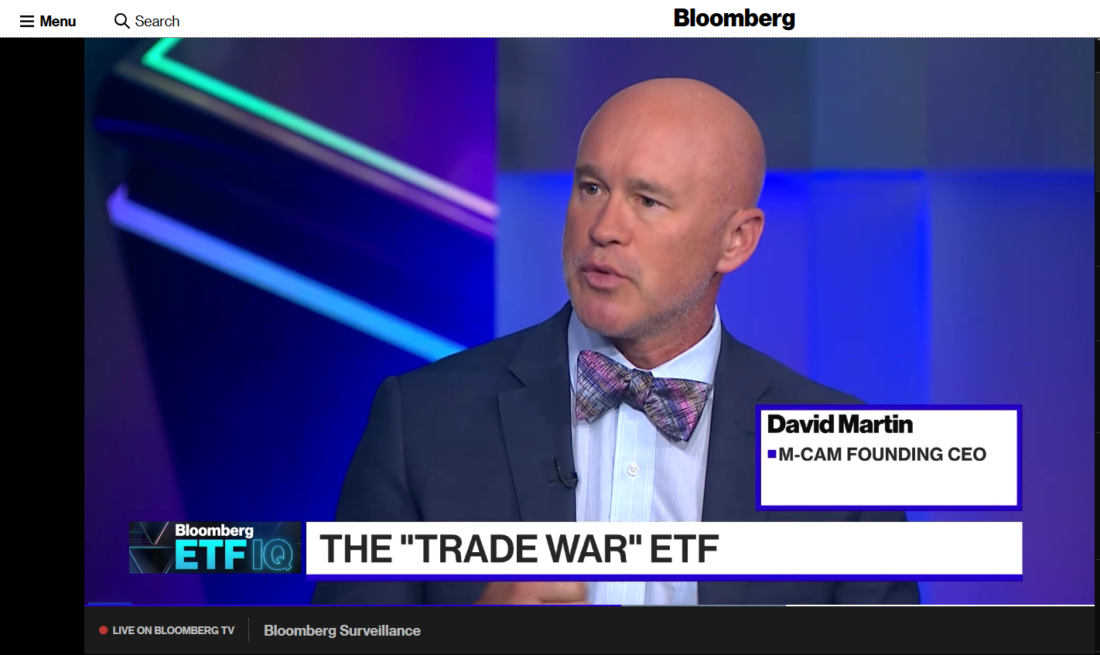
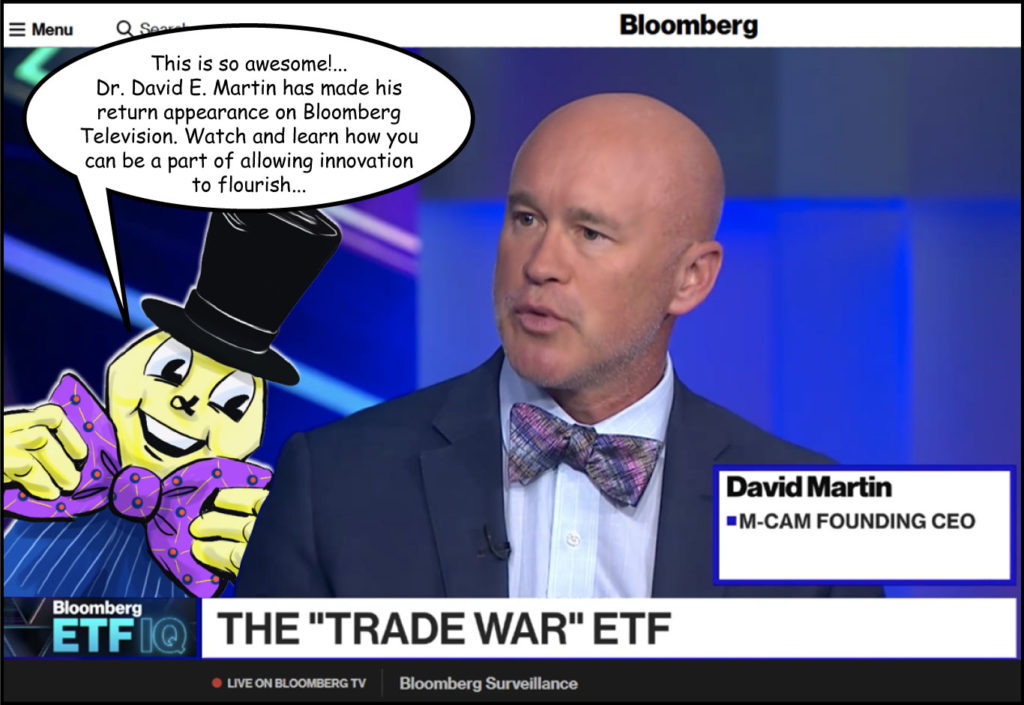
David Martin, Founding CEO of M-CAM , talks with Bloomberg’s Scarlet Fu, Eric Balchunas and Elena Popina about his launch of the trade war ETF, ‘T-WAR and how to benefit from a prolonged tariff fight.
Bloomberg_TV
Our CEO David Martin appeared on Bloomberg today, talking all things ETF and Trade War.
ETF industry debutant Mosaic Collateral Asset Management, or M-CAM, has launched three ETFs on NYSE Arca that provide exposure to firms with strong intellectual property (IP).
This is possibly one of the most accurate, well written articles about the launch of our funds – James Lord did his homework. Thank you James!
Investrends.ch today reported on the launch of TWAR
The Underlying Index was not convincing in the May trading crisis. According to Financial Times research , four of the index’s top 5 holdings (General Electric, Cisco Systems, Xerox and IBM) were outperformed by the S & P 500 in the May calendar month.
CEO of M-CAM says that this snapshot is no proof that his approach is not working.
“Protecting against the effects of a trade war does not isolate a company from other factors that can affect its performance, but over time our strategy should be able to succeed,” said Martin.